Microsoft AdventureWorks: Financial Dashboard
Quick depiction of a Power BI dashboard utilizing Microsoft's sample data
Note: The main image below can be enlarged or scrolled via a mouse click or click and drag (left/right)
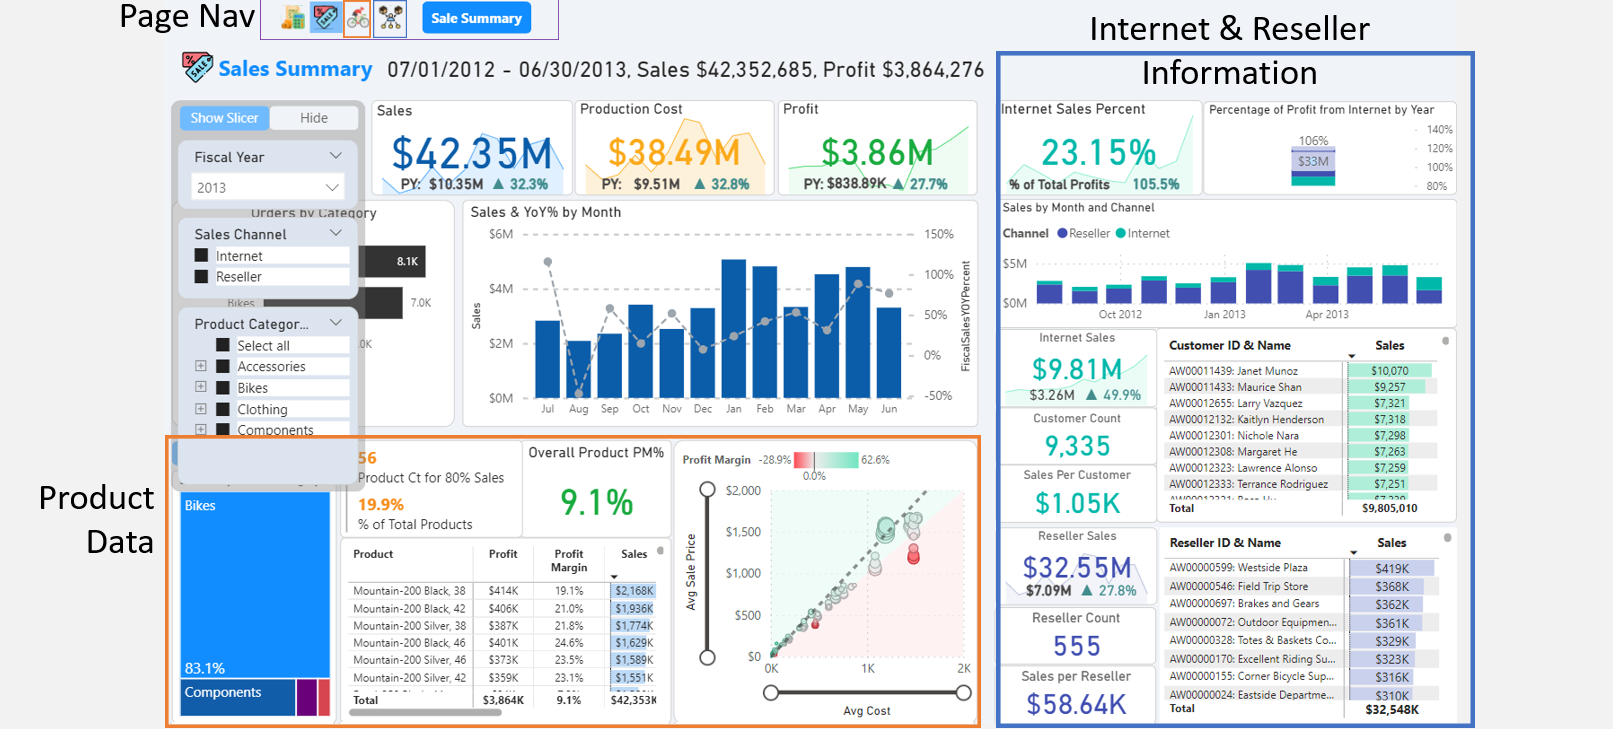

Slide 1: Sale Sum

Slide 2: B2B PM
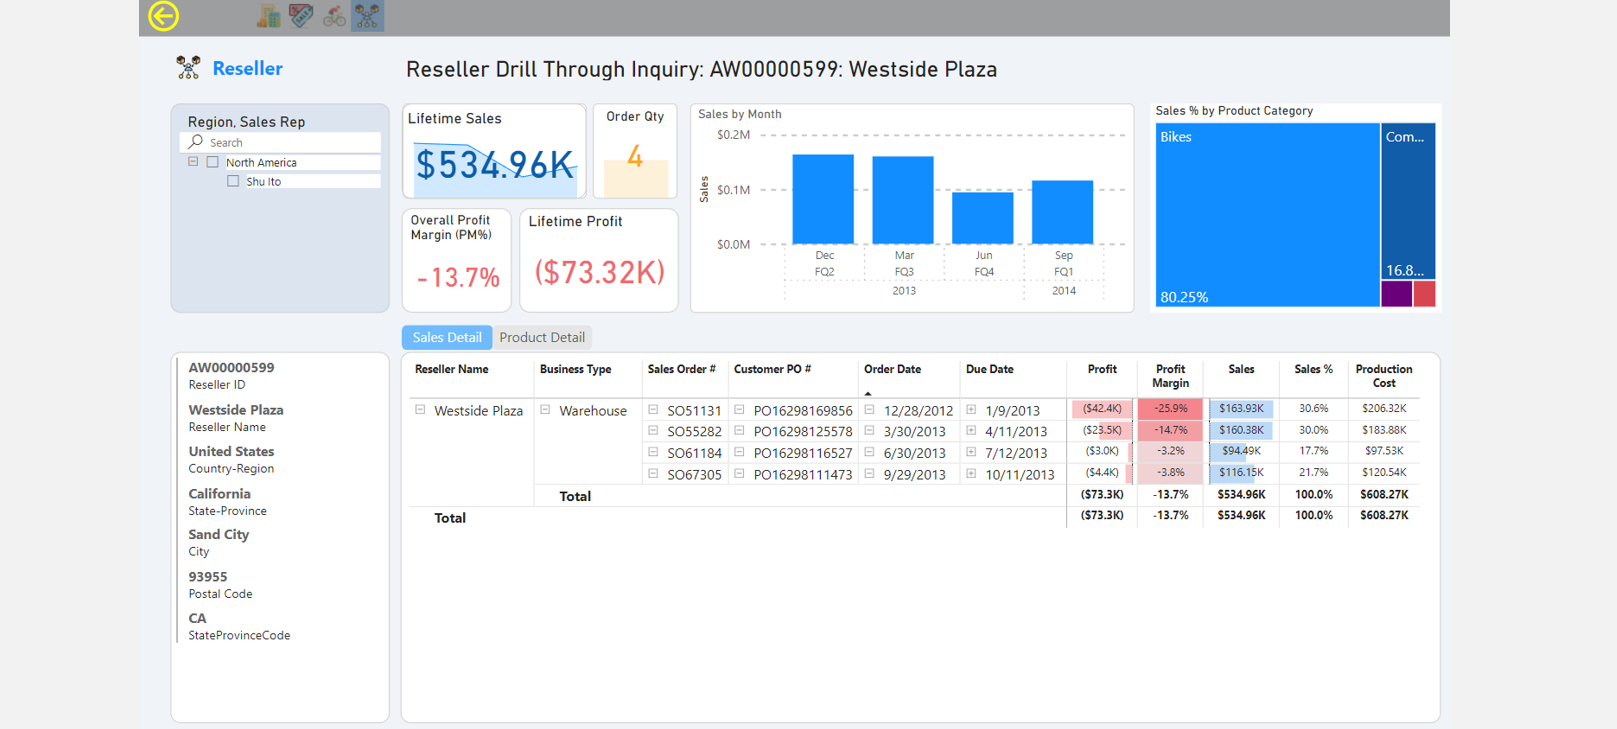
Slide 3: B2B Drill

Slide 4: Pareto

Slide 5: Product PM
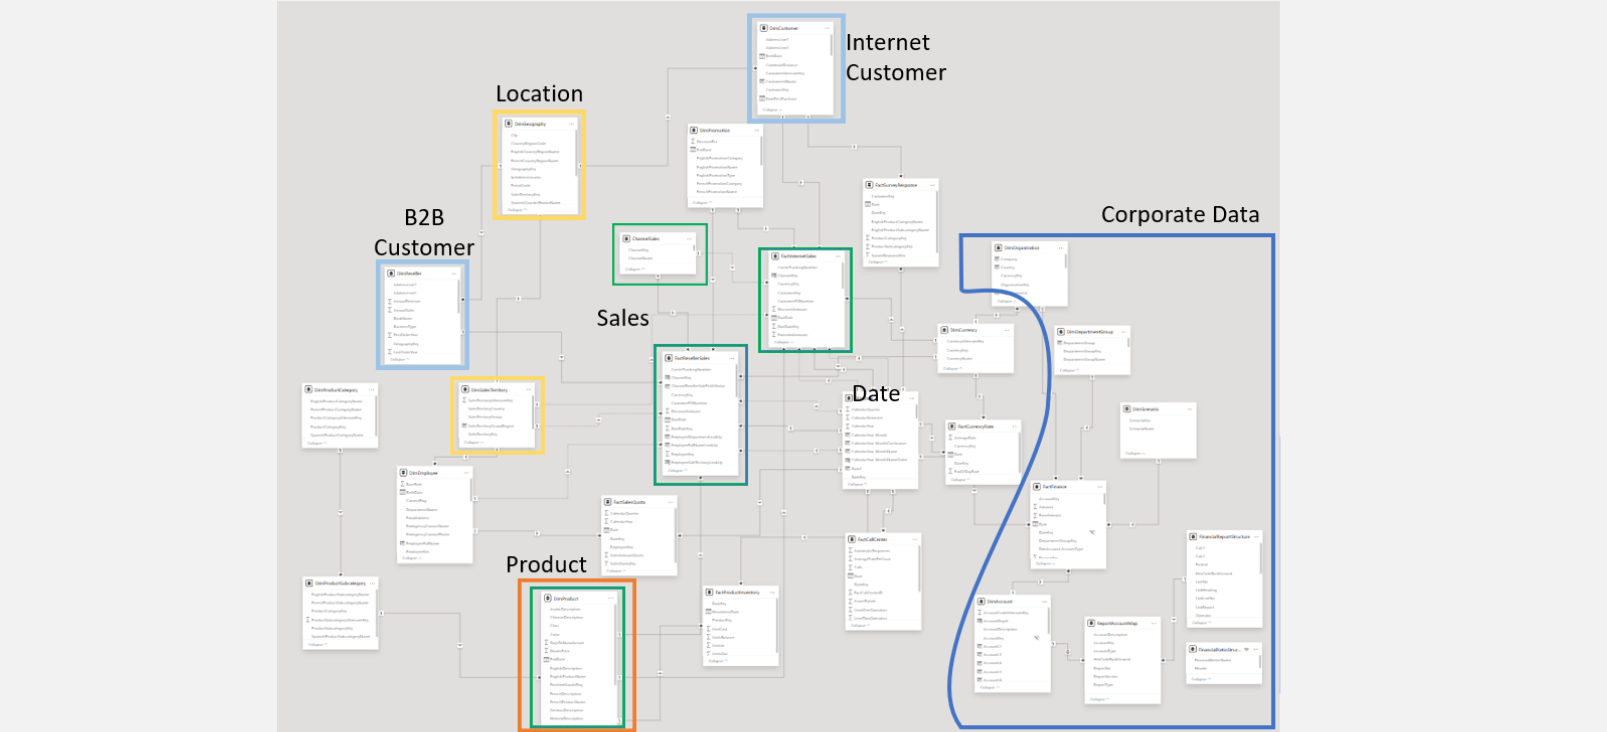
Slide 6: Data Model
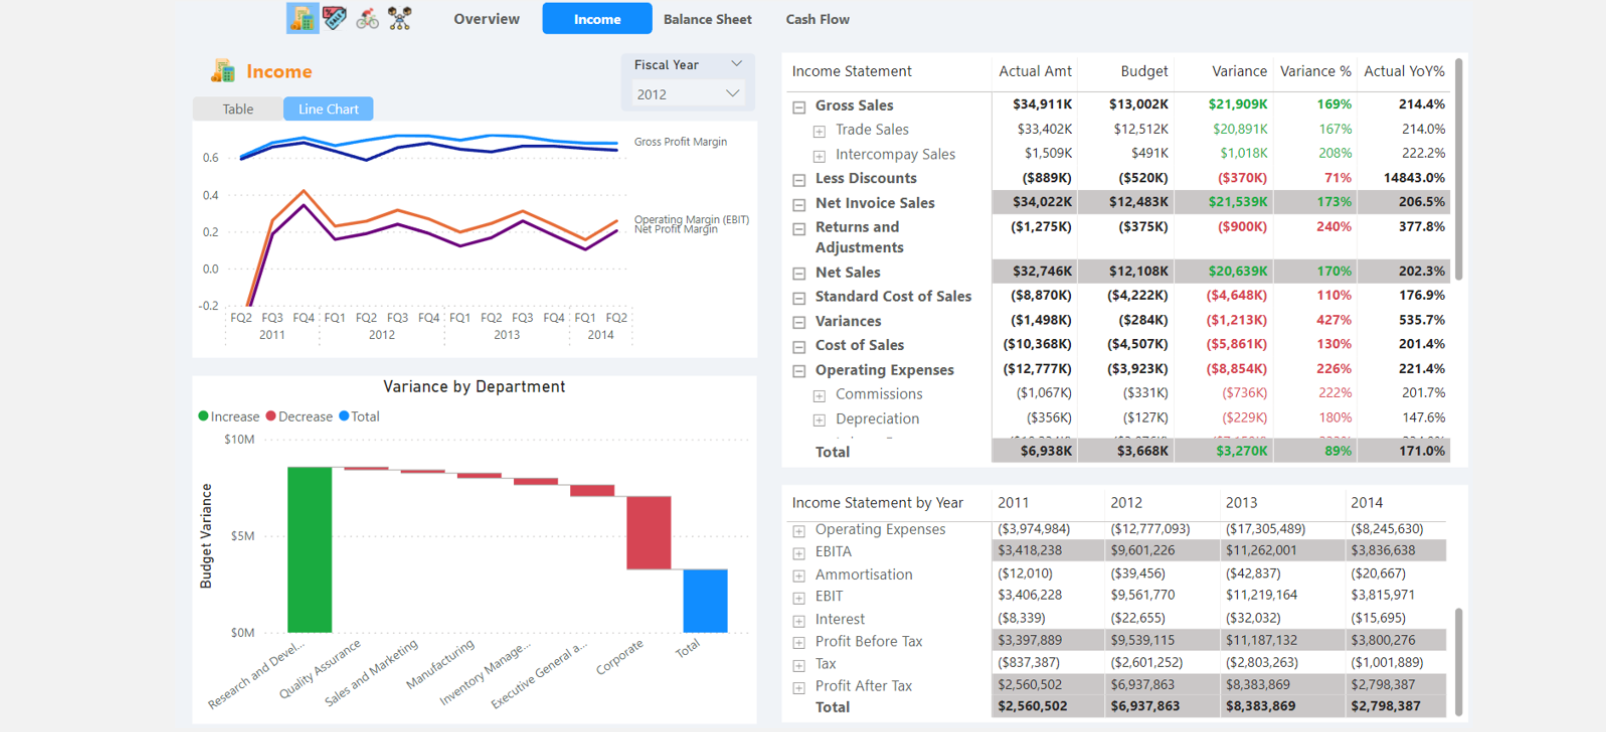
Slide 7: P&L

Slide 8: Balance
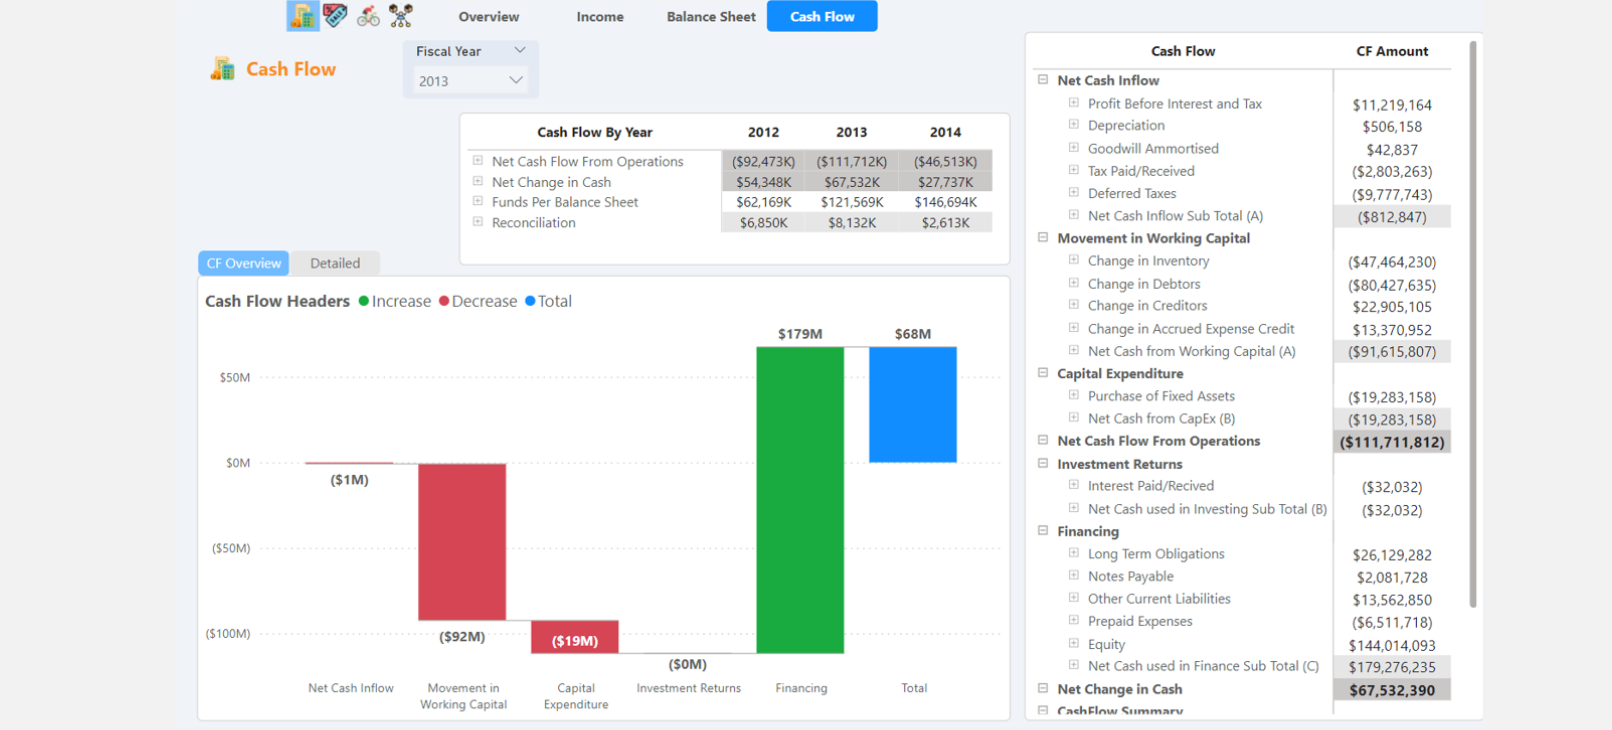
Slide 9: Cash Flow
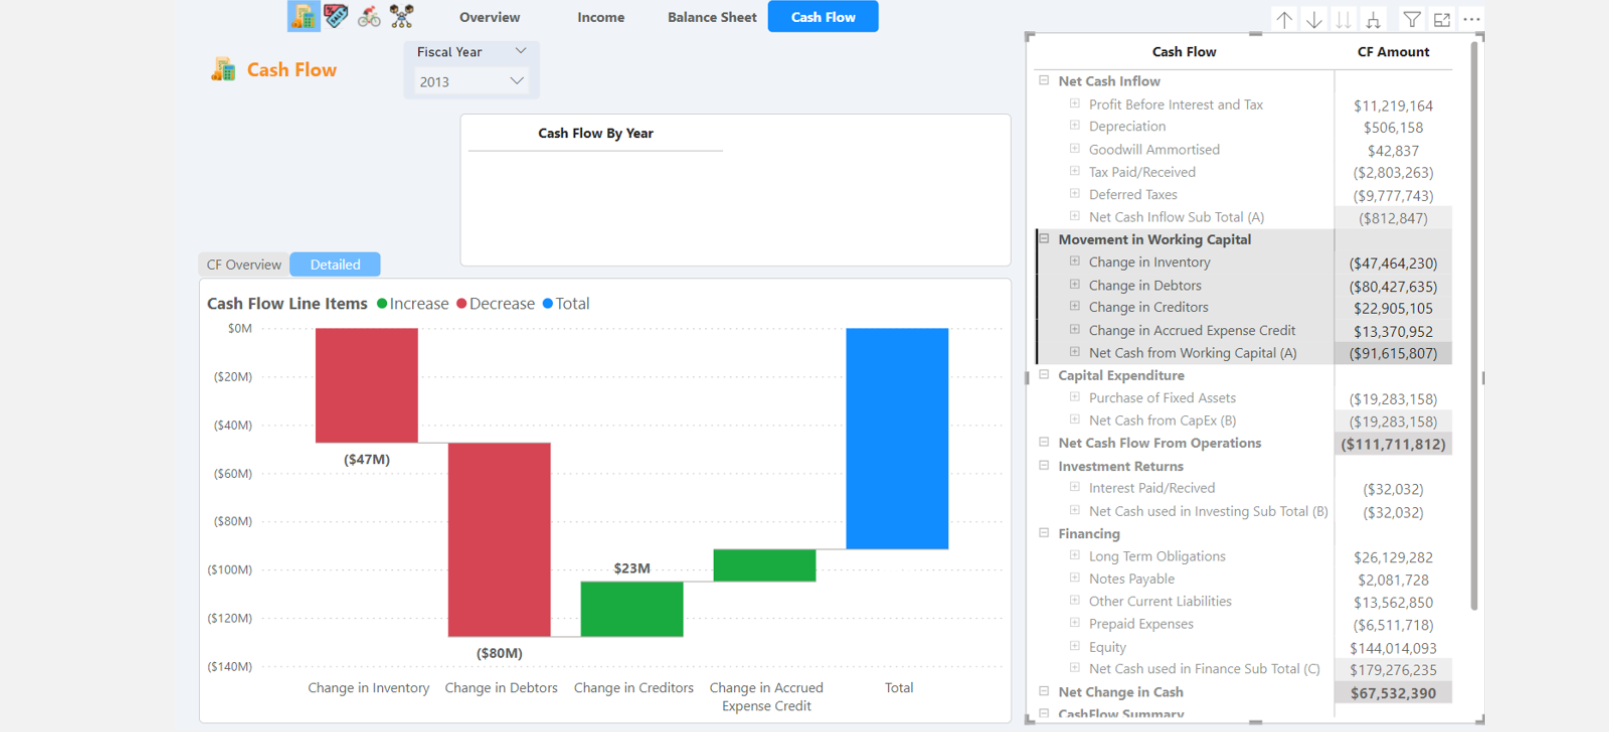
Slide 10: Cash Flow2
Inspiration from this project really came down to a memorable interview.
The director mentioned their problem as a holding company was:
- "We know we are profitable at the end of the year, but we do not know which products are making or losing us money."
For a snapshot regarding an ETL process, click here
Initial Dashboard Goals:
- Create a financial related Power BI Dashboard
- Identify profitability for every company product
Difficulties throughout implementation:
- From 10 slides above that only scratch the surface, the scope of the project expanded as I became more familiar with the sample data - such as the corporate finance component
- There's a lack of documentation regarding this old sample data. This made some interpretations difficult that became more apparent such as operational sales data did not logically match the accounting data provided within the dataset.
- The hardest situations were:
-
1. The pareto parameter page (Slide 4) &
2. Getting the financial statements to work dynamically (Slides 7-10)
Regarding the financial statements, you are essentially calculating various line items on several columns with the "illusion" of a single column showing each line item. Furthermore, there is a many-to-many relationship between the accounting data and the financial template structure.
This relationship makes the model more complex with the benefit of one table for all financial statements, instead of each statement having its own table. Additionally, you can show multiple versions of the same financial statement. For example, if the sales department needs to see profits in one way and the accounting department in another, this is possible within this data model.