Microsoft Power BI:
COVID-19 Dashboard
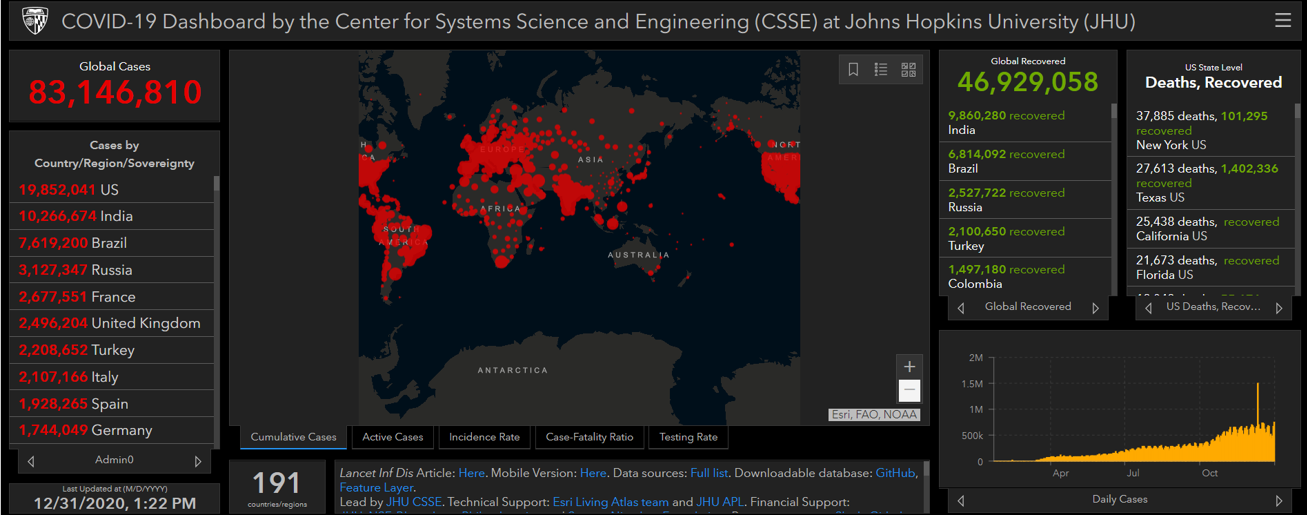
A COVID-19 Dashboard inspired by John Hopkins University
View for a pdf comparison

To see a quick pdf comparison, please click here
To view a summary of some dax functions used, please click here
This page is just a quick showcase of John Hokpins' early dashboard made using ArcGIS compared to my Microsoft Power BI Dashboard. Quite happy with how everything turned out. This project was about learning Power BI and attempt to emulate John Hokpins' Dashboard.
John Hopkin's Current Dashboard, please click here
Timeseries data provided by JHU, please click here